We are pleased to announce a major update to the Insights Platform, introducing new features and enhancements that improve clarity, efficiency, and accuracy across multiple workflows. These changes are designed to streamline planning, enhance transparency, and ensure precise representation of data in charts, tables, and downloadable outputs.
This release includes:
- 1. Visual Labelling of Build-Up Periods
- 2. Enter Scenario Values for UIDs with Zero Historical Spend
- 3. Period-Based Filter in Activities Module
- 4. Enhanced Constraint Management Logic
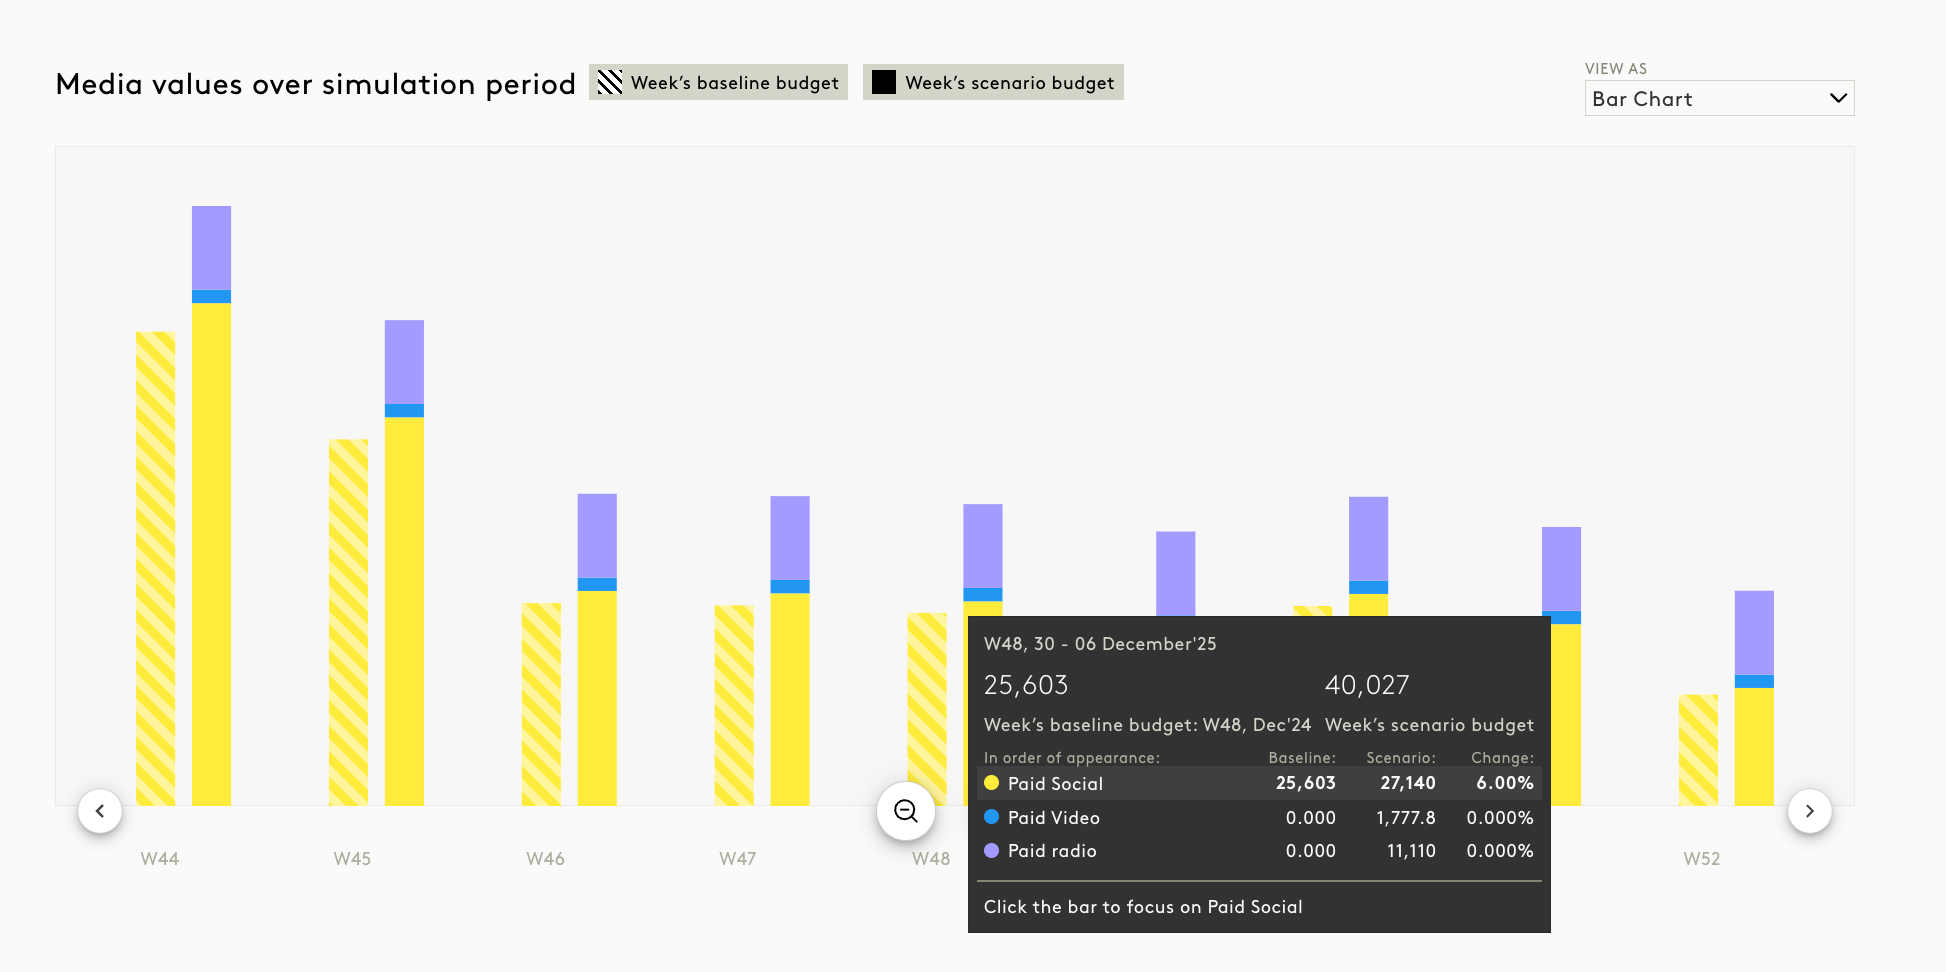
1. Visual Labelling of Build-Up Periods
The Visual Labelling of Build-Up Periods feature introduces clear indicators in charts and tables to help users identify padded build-up periods at a glance. This enhancement improves transparency and prevents misinterpretation of non-observed data.
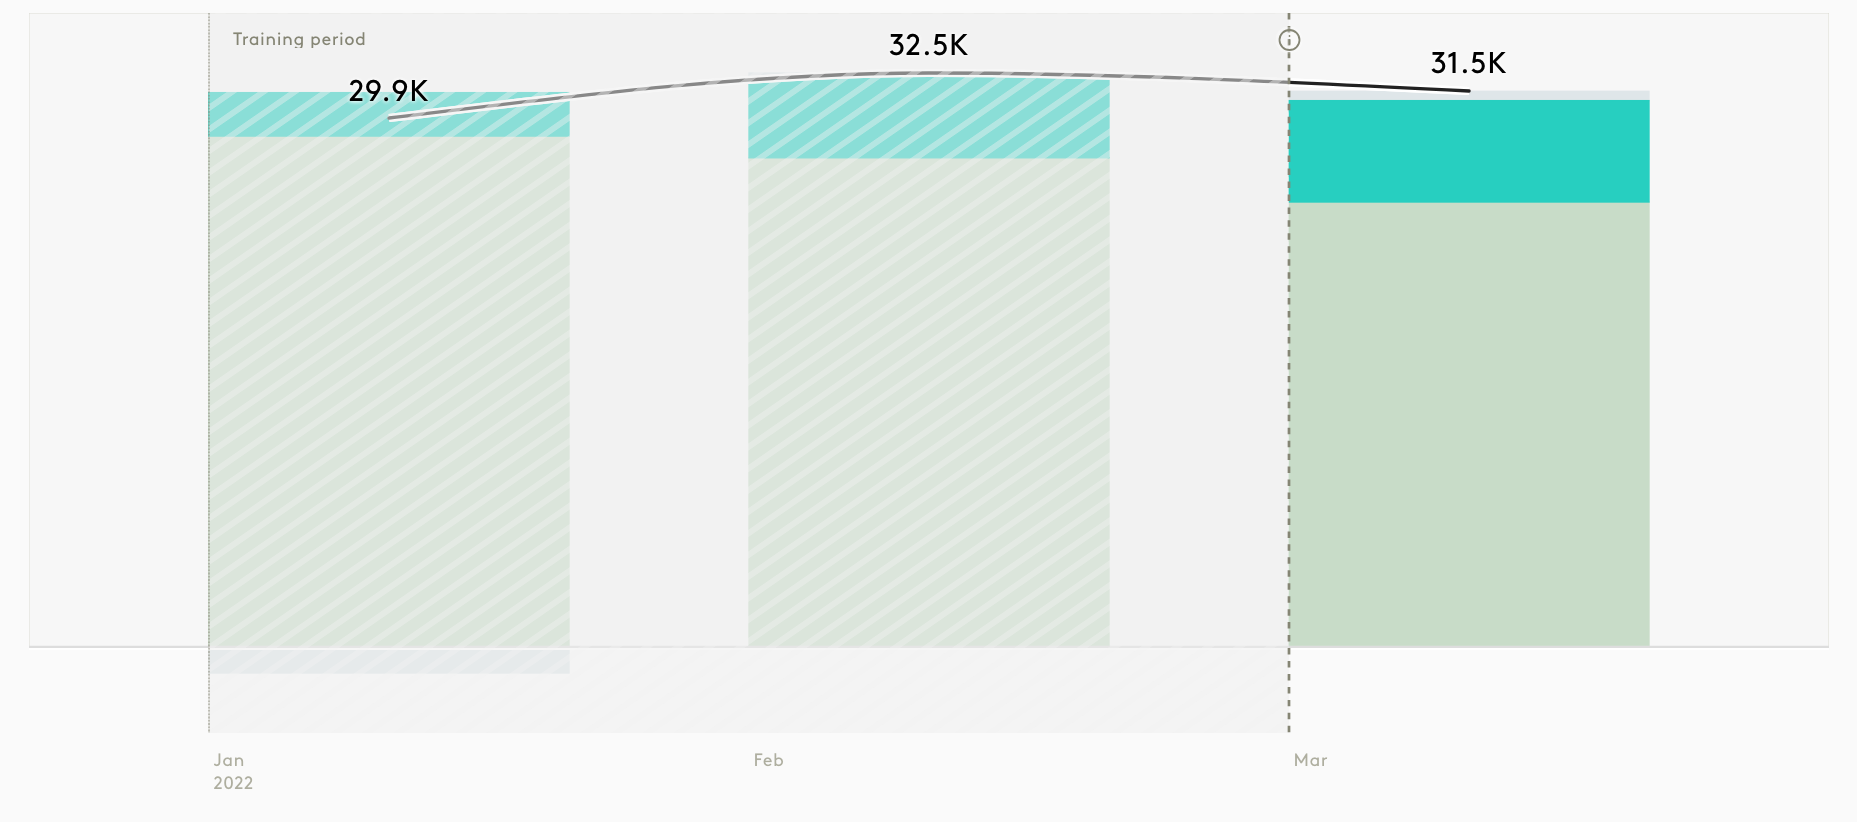
Notice the new Visual Labelling
- Navigate to Insights Pages
Go to Business Insights (BI) or Media Insights (MI) within the platform. - Open Charts or Tables
Access any chart or table that includes model output data. - Identify Build-Up Period Indicators
- Look for shaded areas or labelled sections in the timeline.
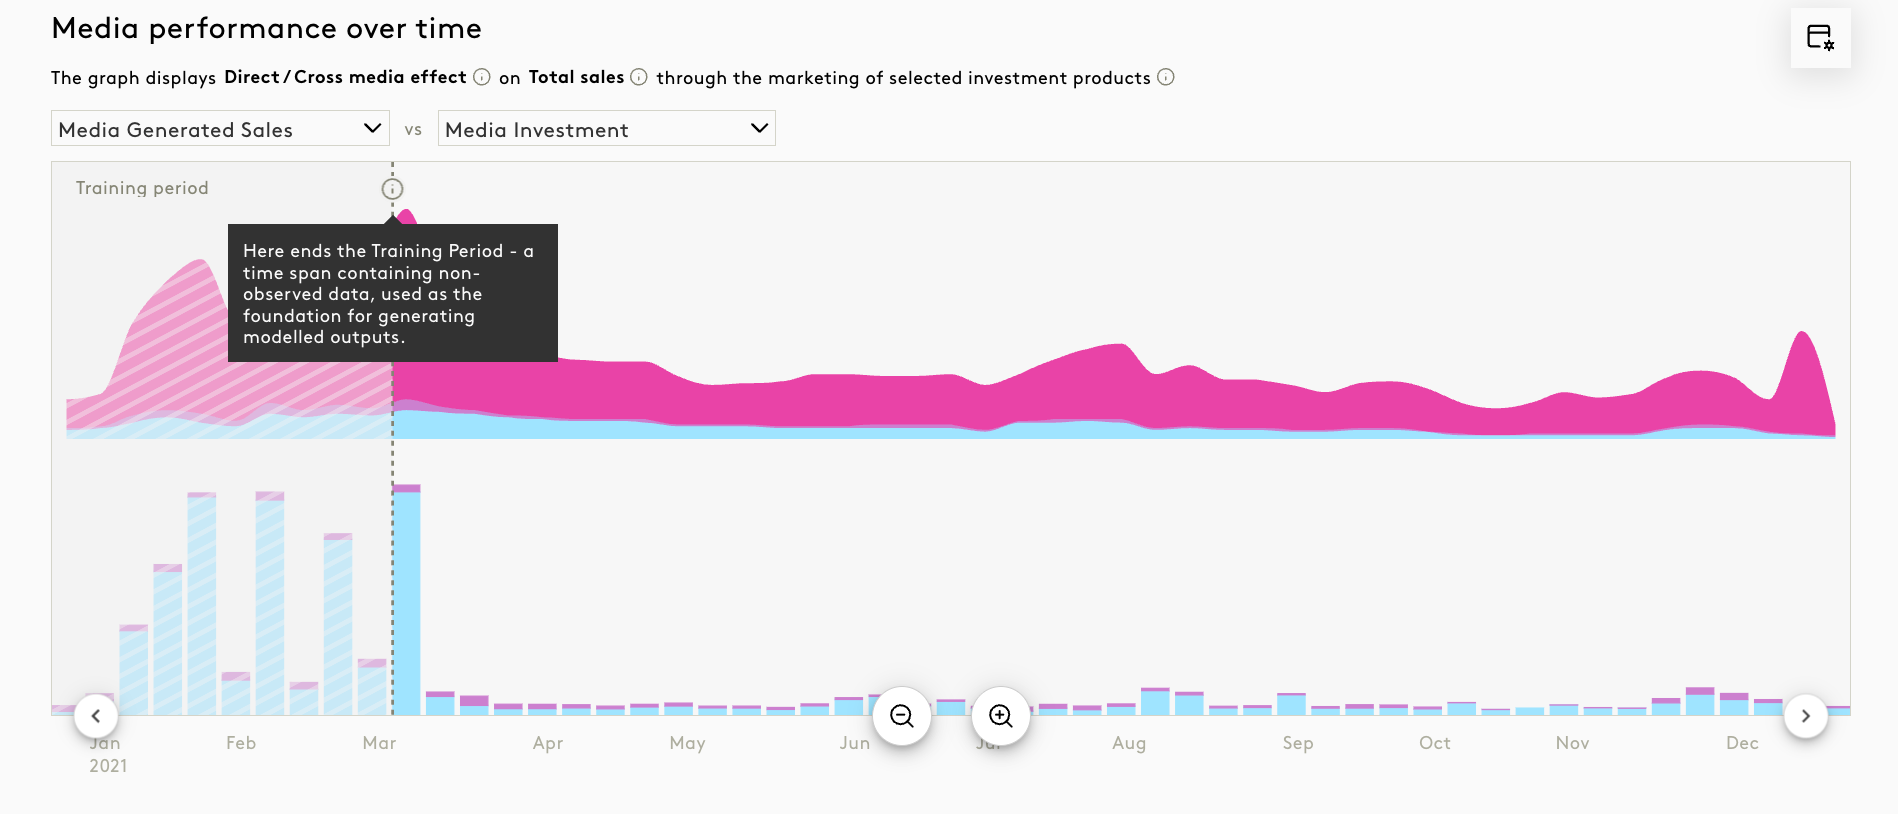
- Hover over the shaded area to view a tooltip explaining the build-up period.
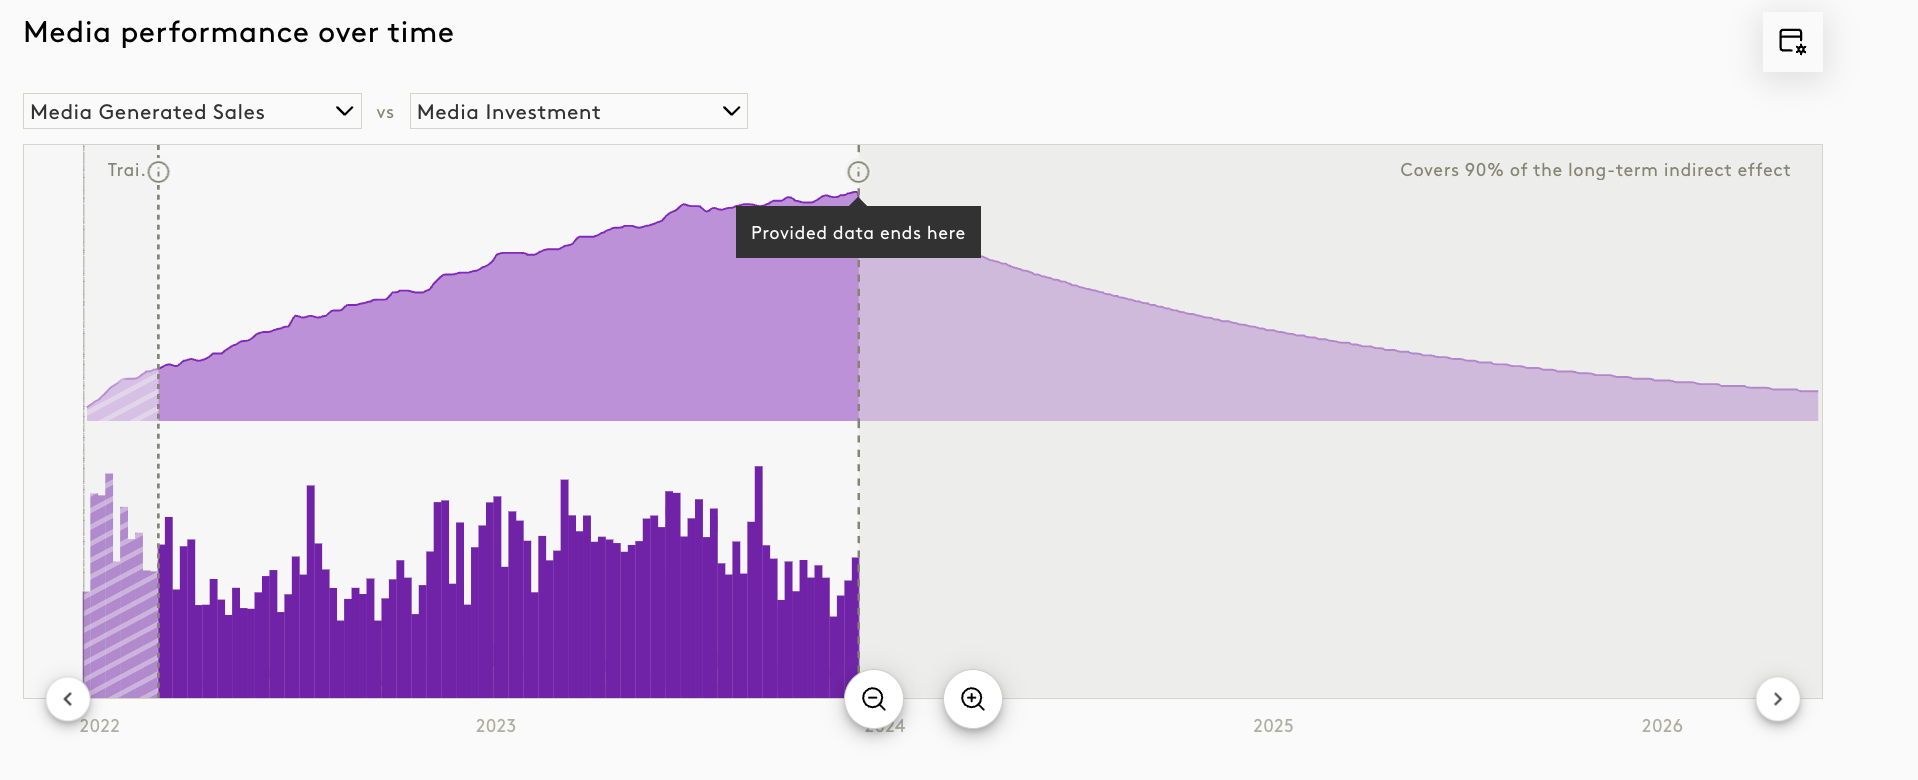
- In some cases, a banner message may appear at the top of the chart for additional context.
- Look for shaded areas or labelled sections in the timeline.
- In Exported Reports
When exporting reports, build-up periods will include optional callouts for clarity.
Impact
- Labels and shading appear consistently across Business Insights (BI) and Media Insights (MI).
- Optional callouts are included in downloadable reports.
- Tooltips or banners explain what build-up periods represent.
- Prevents incorrect interpretation of padded data in dashboards and reports.
2. Enter Scenario Values for UIDs with Zero Historical Spend
This enhancement allows users to input total spend directly for UIDs with no historical spend in the Simulator. Previously, planning for these UIDs required Excel uploads, which was time-consuming. With this update, users can now streamline planning workflows and enable forward-looking investment strategies directly in the platform.
Steps to Enter Scenario Values
- Navigate to Simulator
Go to the Simulator module within the Insights Platform. - Select the Scenario
Choose the scenario where you want to add spend for zero-spend UIDs. - Locate UIDs with Zero Historical Spend
Identify UIDs that show no historical spend in the past 12 months.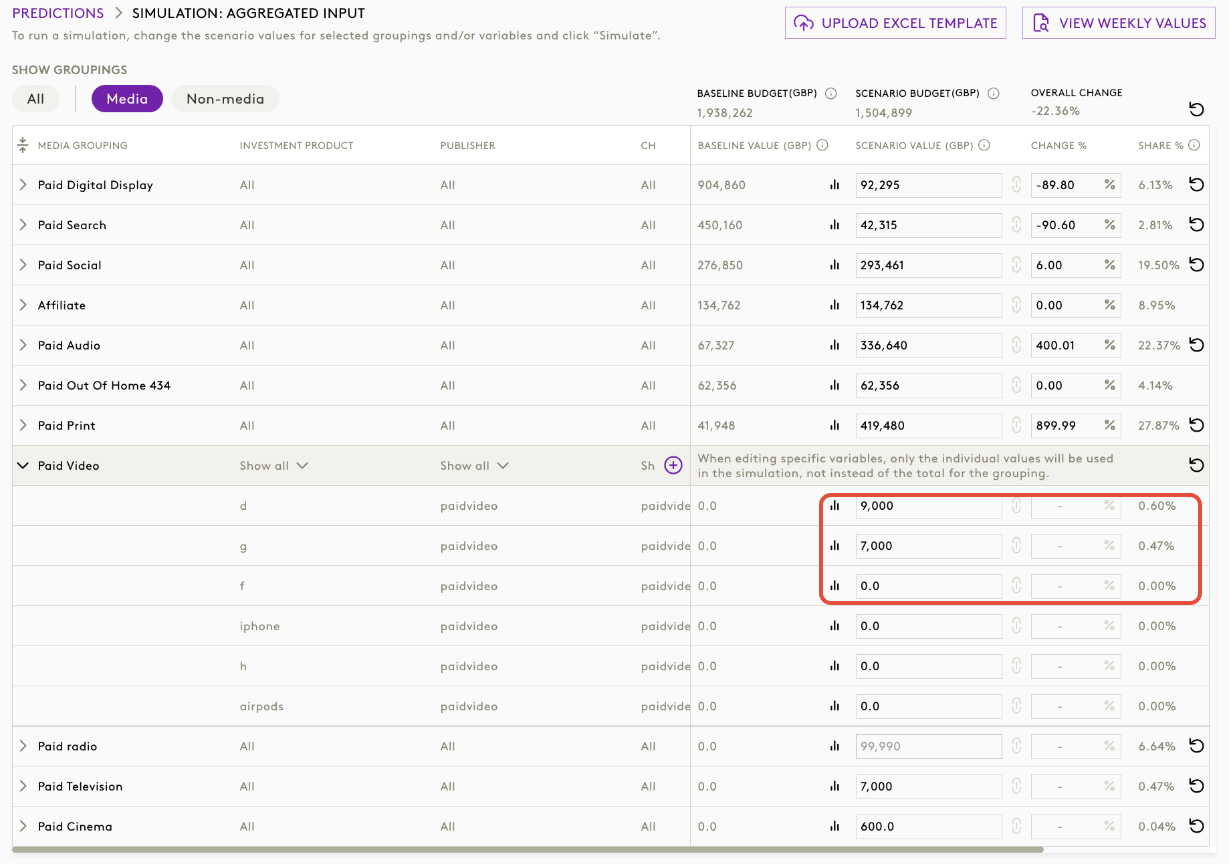
- Enter Total Spend
- In the Total Spend column, input the desired amount for the UID.
- The system will automatically distribute the spend across weeks based on internal rules.
- Review Percentage Column
- For zero-spend UIDs, the % Change column will display “New!”, blank, or “NA”.
- Validate Outputs
- Ensure that the weekly breakdown and totalsmatch your expectations.
- Extracts will reflect the entered totals accurately.
Impact
- Direct entry enabled for UIDs with zero historical spend.
- Percentage column displays “New!”, blank, or “NA” instead of a calculated value.
- Weekly breakdown auto-distributes after total entry.
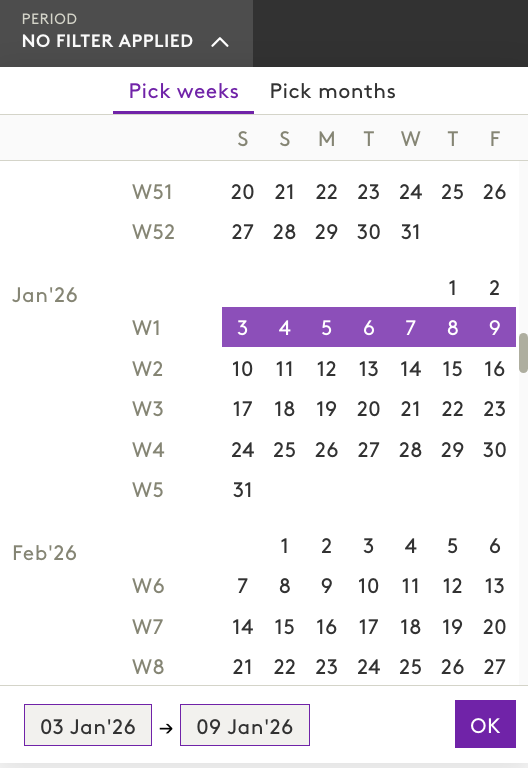
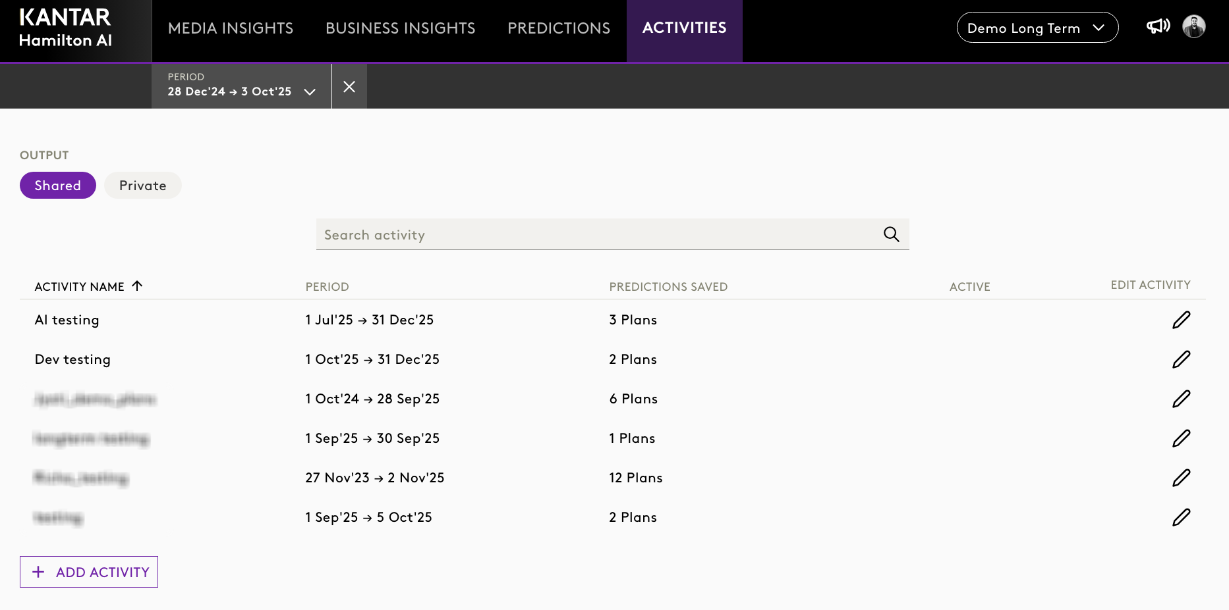
3. Period-Based Filter in Activities Module
The Period-Based Filter is a new enhancement in the Activities Module that allows users to filter saved simulations and optimisations based on selected time periods. This feature is particularly useful when working with a large number of saved activities, helping users quickly locate relevant items for analysis or reporting.
Impact
- The filter is visible in the global bar of the Activities module.
- Applies to both folder list view and inside individual folders.
- Works for Optimisation and Simulation items.
- Period column dynamically updates based on the selected filter.
Steps to Use Period-Based Filter
- Navigate to Activities Module
Go to the Activities section from the main navigation bar. - Locate the Global Bar
At the top of the Activities module, find the Period Filter dropdown.
- Select a Time Range
- Choose from either weeks or from months.
- Alternatively, select Custom Range and specify start and end dates.
- Apply the Filter
- Once the range is selected, the Activities list will refresh to show only items within the chosen period.
- Review Results
- Filter applies consistently across folder overview pages and inside individual folders.
- Both Optimisation and Simulation activities will be displayed according to the selected period.
4. Enhanced Constraint Management Logic
The Constraint Management Logic has been updated to ensure accurate calculation of historical values for group-level constraints. Previously, baseline values were derived by summing individual UID min/max/avg values, which could lead to inconsistencies. The new logic aggregates time-series data at the group level first, then calculates minimum, maximum, and average from this combined series.
Impact
- Historical values displayed in Constraint Management now reflect true aggregated behaviour.
- Baseline calculations for group constraints are accurate and consistent.
- Applies to all constraint-related workflows in Simulator and Optimisation.
Was this article helpful?
That’s Great!
Thank you for your feedback
Sorry! We couldn't be helpful
Thank you for your feedback
Feedback sent
We appreciate your effort and will try to fix the article