This release introduces a new Sub-Model Analysis view within Simulator outputs, enabling users to better understand the drivers behind changes in brand and business KPIs generated through optimisation scenarios.
In addition, the Optimiser configuration experience has been enhanced through the introduction of a dedicated full-page setup workflow, providing a more scalable and user-friendly experience for configuring optimisation plans.
TABLE OF CONTENTS
1. Sub-Model Analysis Tab in Simulator Outputs
Overview
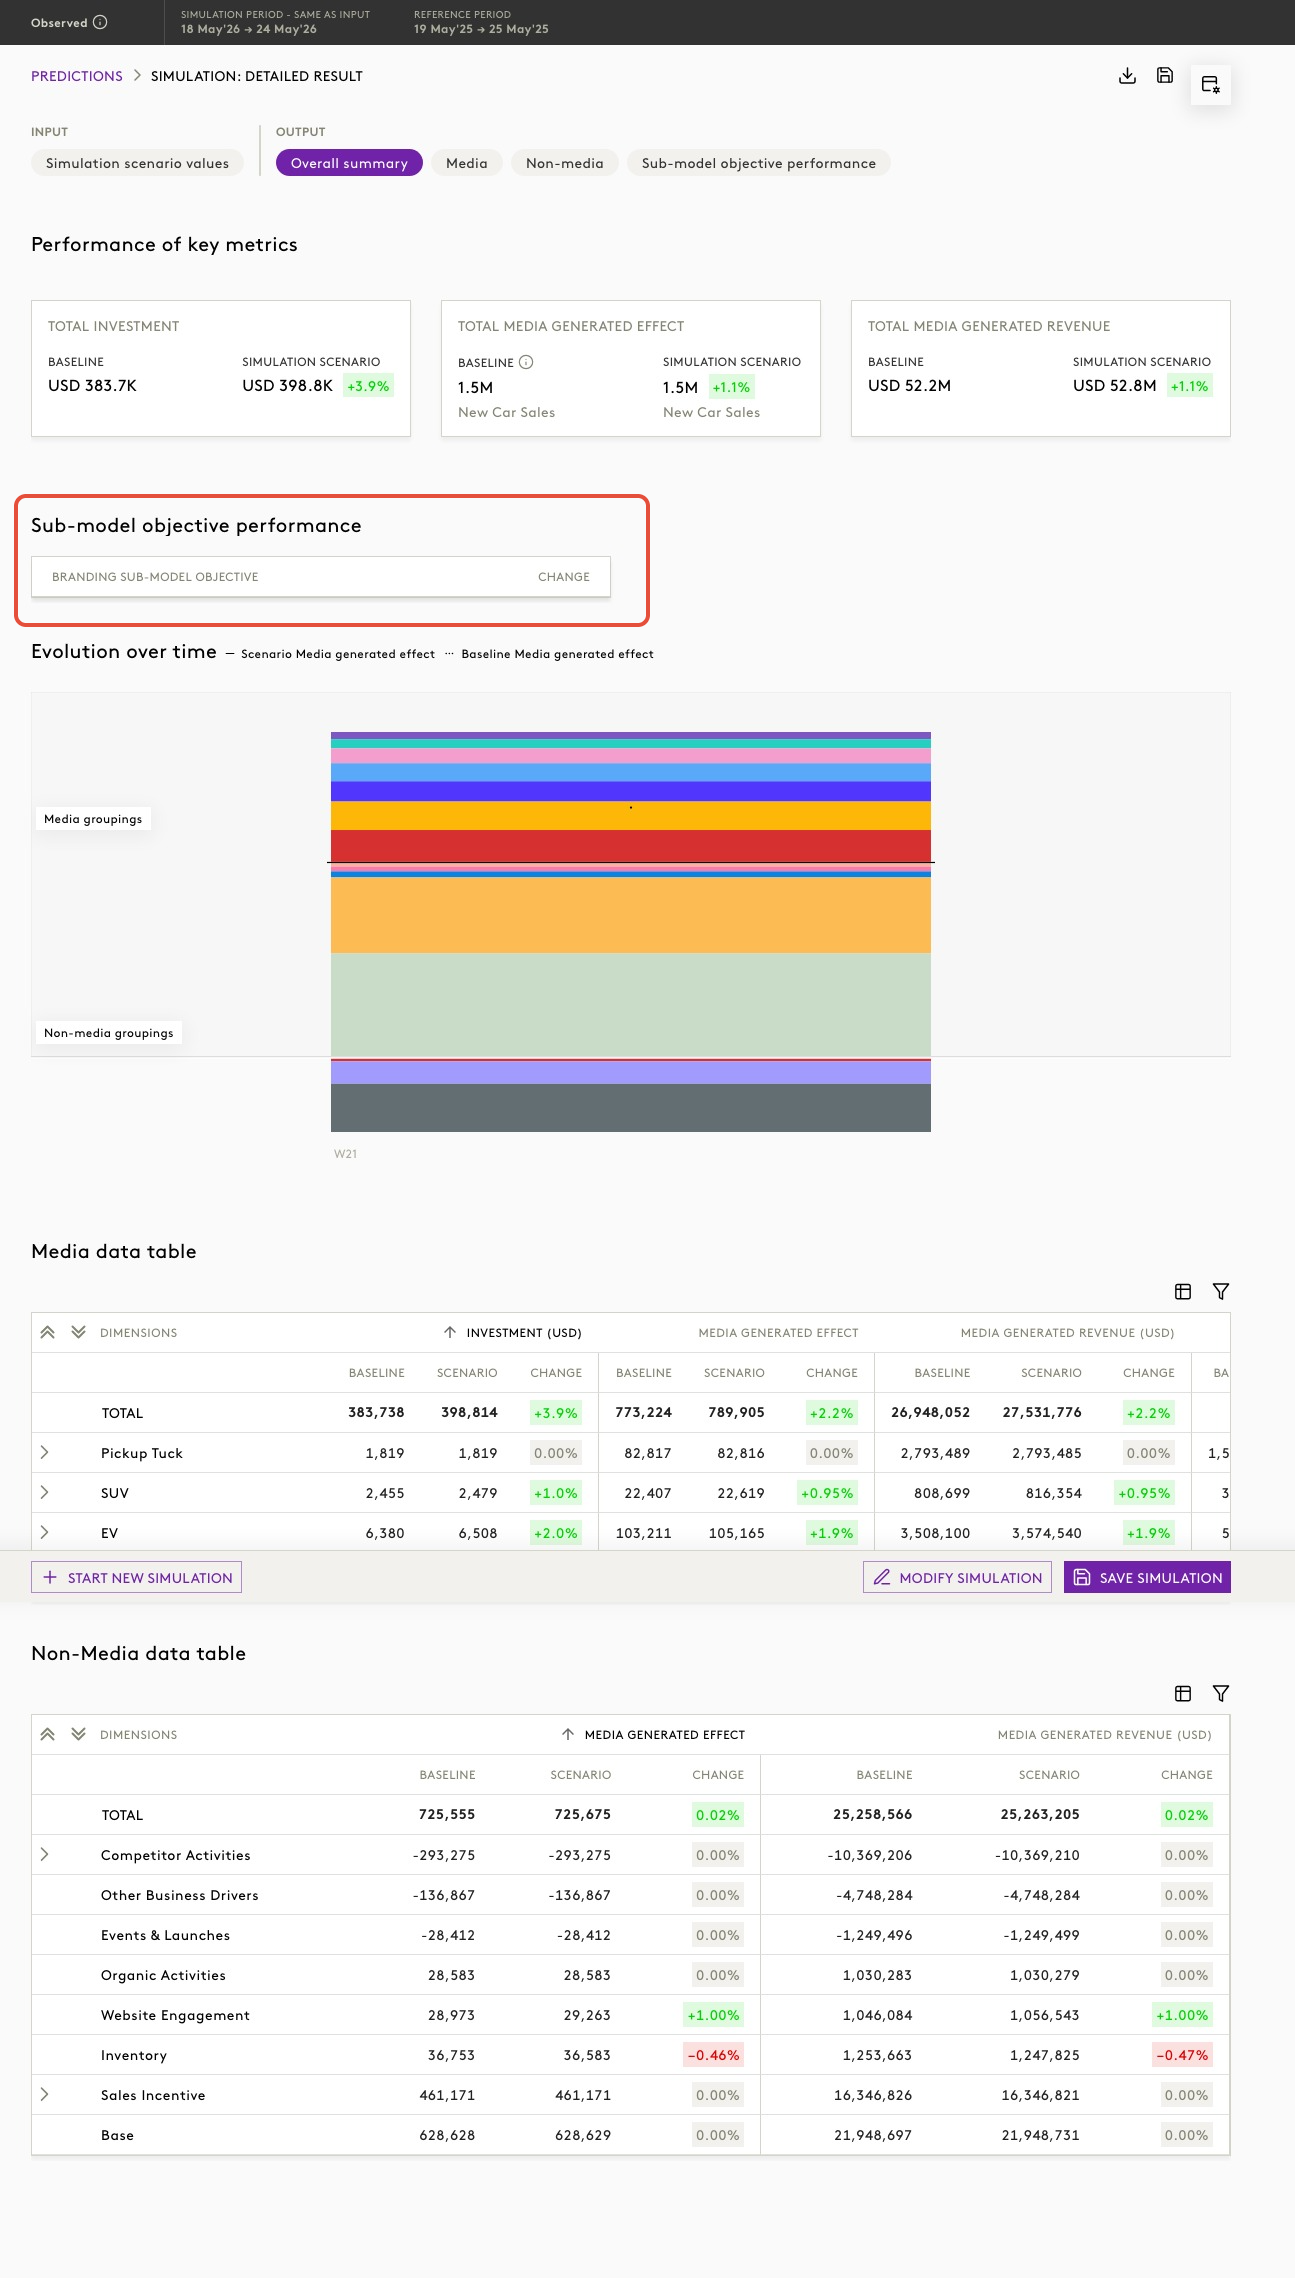
A new “Sub-Model Analysis” tab has been added to the Simulator results view, enabling detailed decomposition of sub-model KPIs. This enhances the Simulator by providing visibility into how simulation changes affect not only the primary KPI, but also brand and non-paid KPIs such as Awareness, Consideration, Organic Traffic, and other sub-model objectives.
This enables users to evaluate trade-offs across multiple business outcomes within a single simulation.

Why this feature matters
Previously, simulation outputs focused primarily on the main KPI, limiting visibility into broader business impacts.
With this enhancement, users can:
- Understand the impact of changes across brand and non-paid KPIs
- Evaluate trade-offs between performance and long-term brand outcomes
- Make more informed and balanced planning decisions
Where to find this in the UI
Navigate to:
Simulator → Detailed Output → Sub-model objective performance
You will also see KPI impact reflected across:
- Overall summary tab
- Media and Non-media data tables
- Sub-model objective performance tab
How it works
Step 1: Run a simulation
- Configure simulation inputs (media and non-media variables)
- Execute the simulation
Step 2: View overall KPI changes
In the Overall summary section:
- Key metrics such as:
- Total Investment
- Total Effects
- Total Revenue / Profit
are displayed with:
- Baseline values
- Simulation values
- Percentage change
Step 3: Analyse sub-model KPI impact
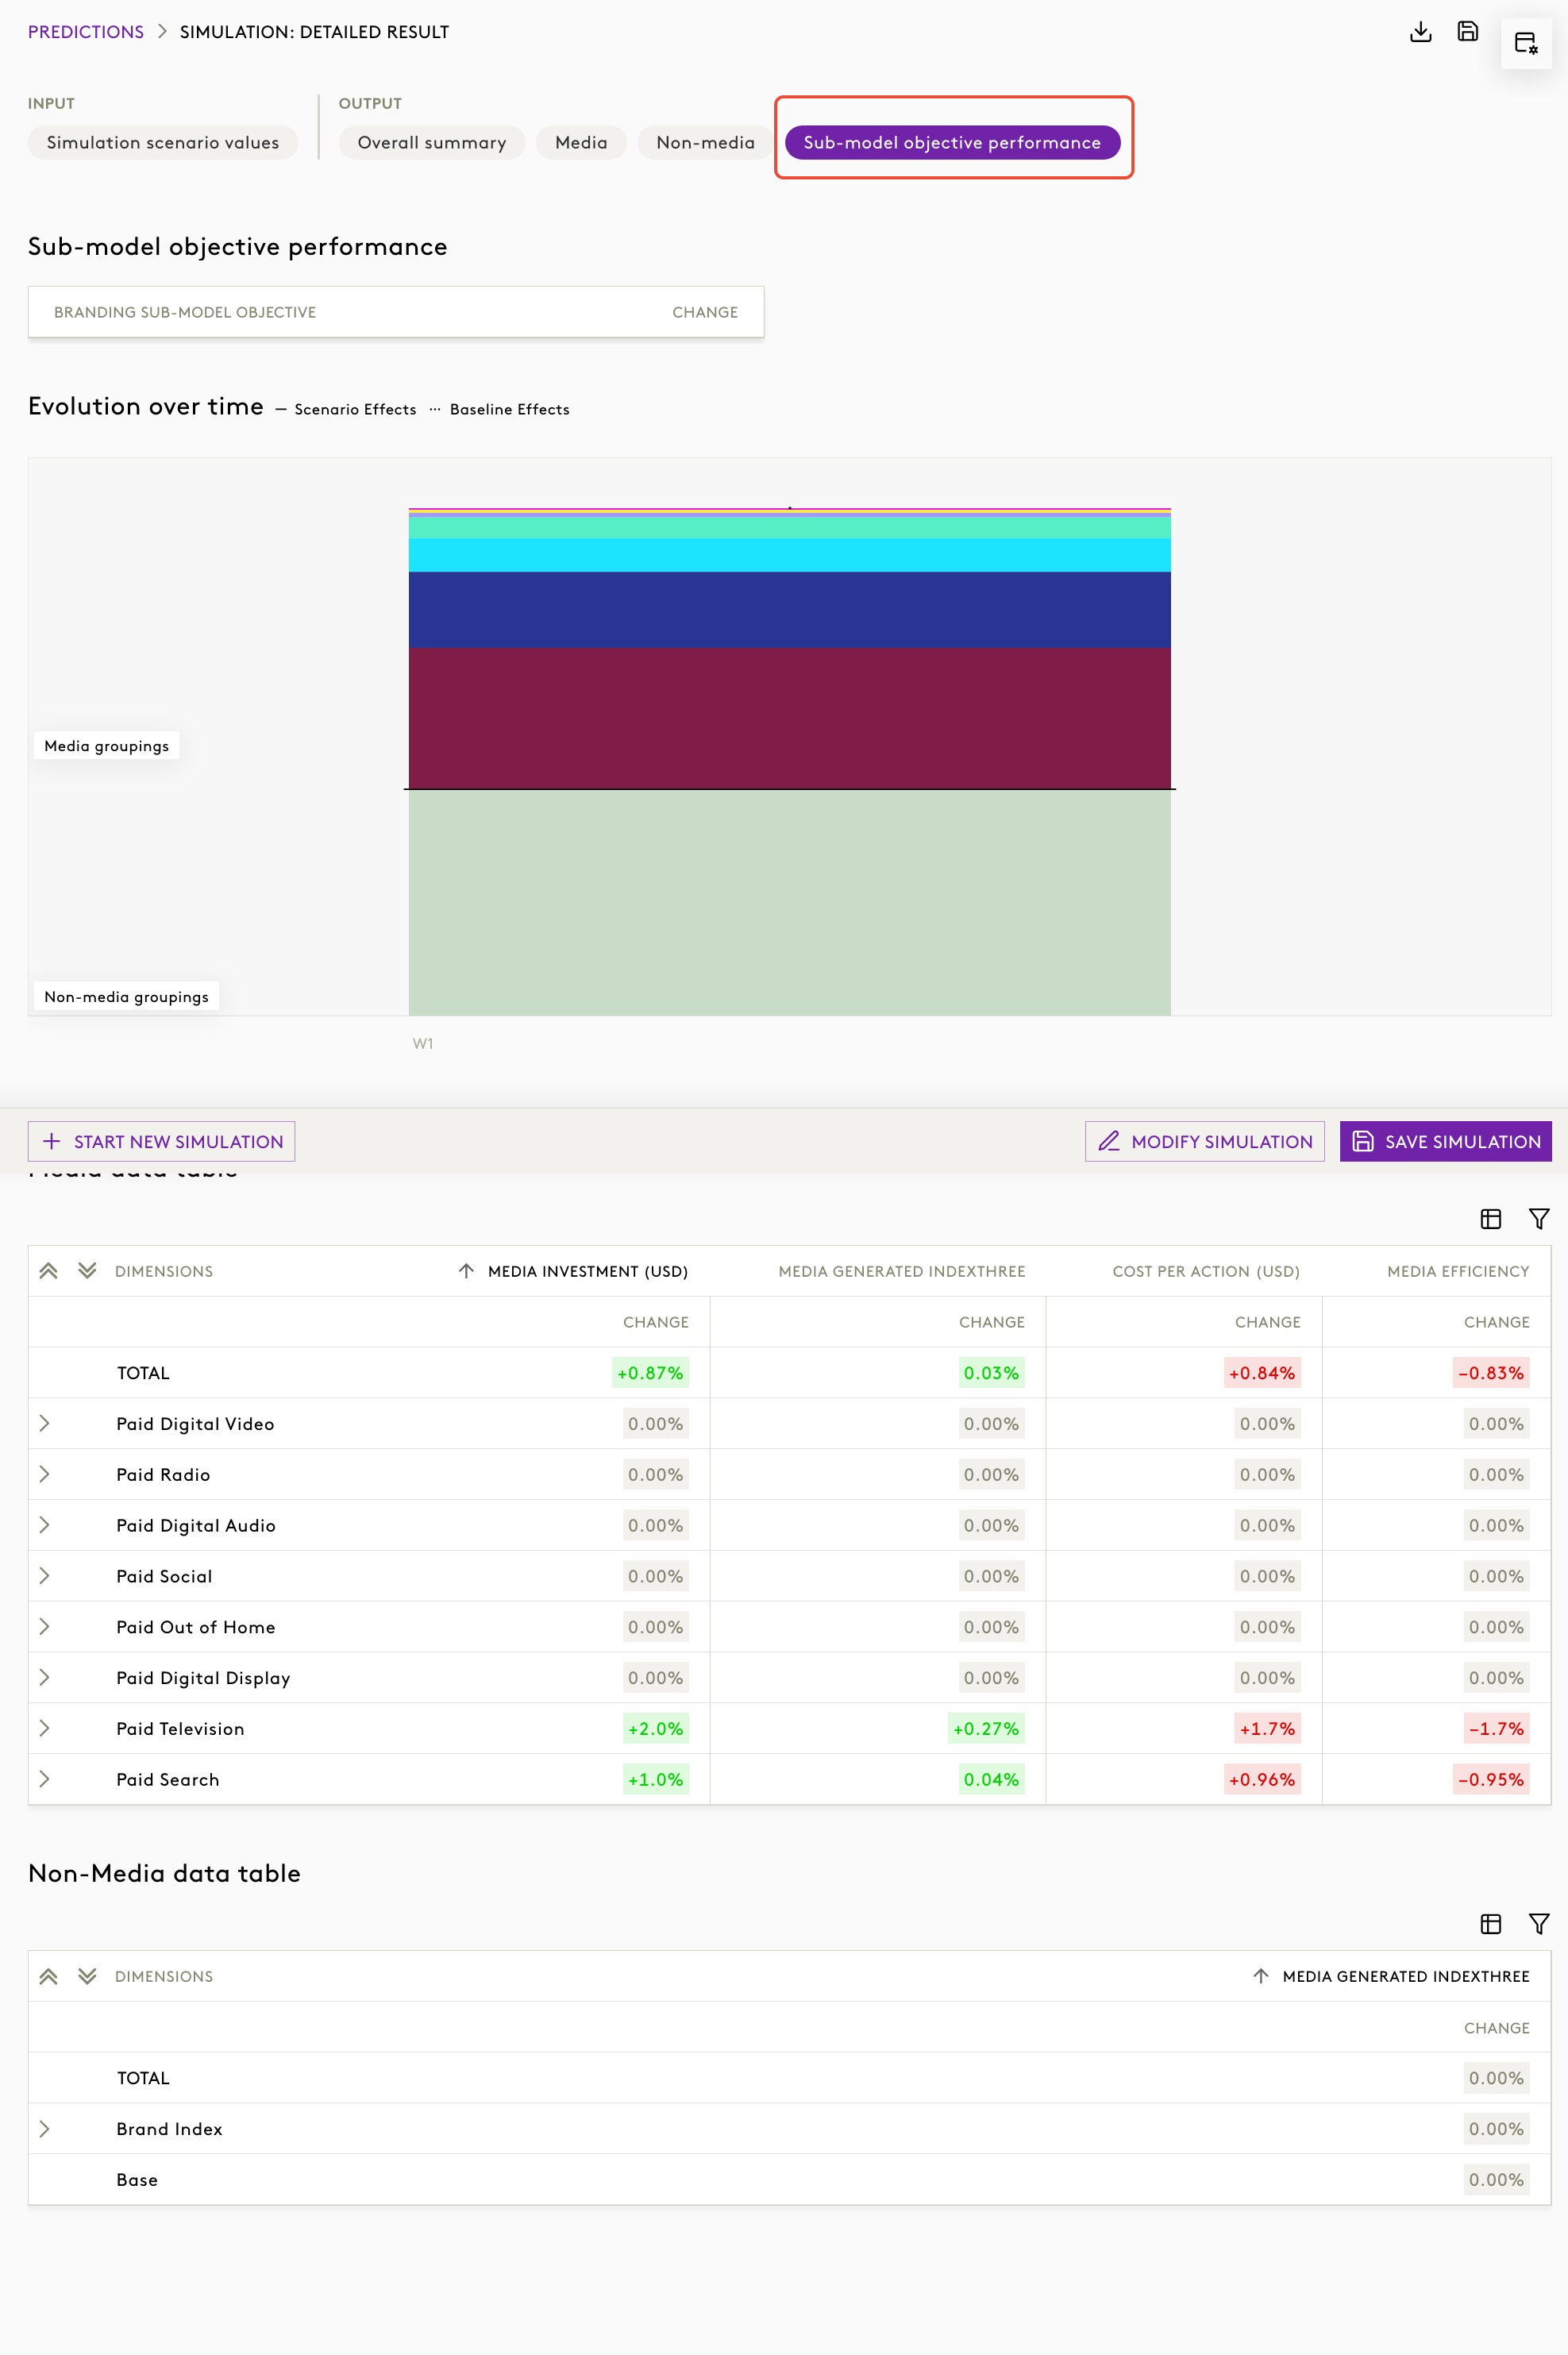
Navigate to Sub-model objective performance:
- View percentage change vs baseline for supported sub-model KPIs
- Includes:
- Brand KPIs (e.g. awareness-type metrics)
- Non-paid KPIs (e.g. organic or external drivers)
Step 4: Explore detailed breakdowns
Media data table
- Displays:
- Investment
- Effects
- Revenue / Profit
- Includes:
- Baseline vs Scenario comparison
- % change for each dimension (e.g. channels like Paid Search, TV)
Non-media data table
- Displays impact from:
- Competitor activities
- Organic drivers
- External factors
- Shows:
- Baseline vs Scenario values
- % change for each category
Step 5: Track changes over time
The Evolution over time visual:
- Compares:
- Scenario vs Baseline
- Separates:
- Media groupings
- Non-media groupings
This helps users understand how changes evolve throughout the simulation period.
Key behaviour
- KPI changes are shown as percentage change vs baseline
- Updates dynamically when:
- Optimisation plans are loaded
- Media inputs are modified
- Non-media variables are adjusted
- Results are available in:
- Detailed Output view only
Important limitations
- Sub-model KPI values are currently shown as:
- Percentage change only (for branding KPIs)
- Baseline and scenario values for brand KPIs are not displayed
- Sub-model KPI results are:
- Visible in Detailed Output
- Not yet fully available in saved simulation plans (Activities view)
Things to keep in mind
- Brand KPIs currently do not include a saturation function
- This means:
- Values may exceed expected ranges
- Guardrails act as guidance to control extremes
- Always review multiple KPIs together to understand full trade-offs
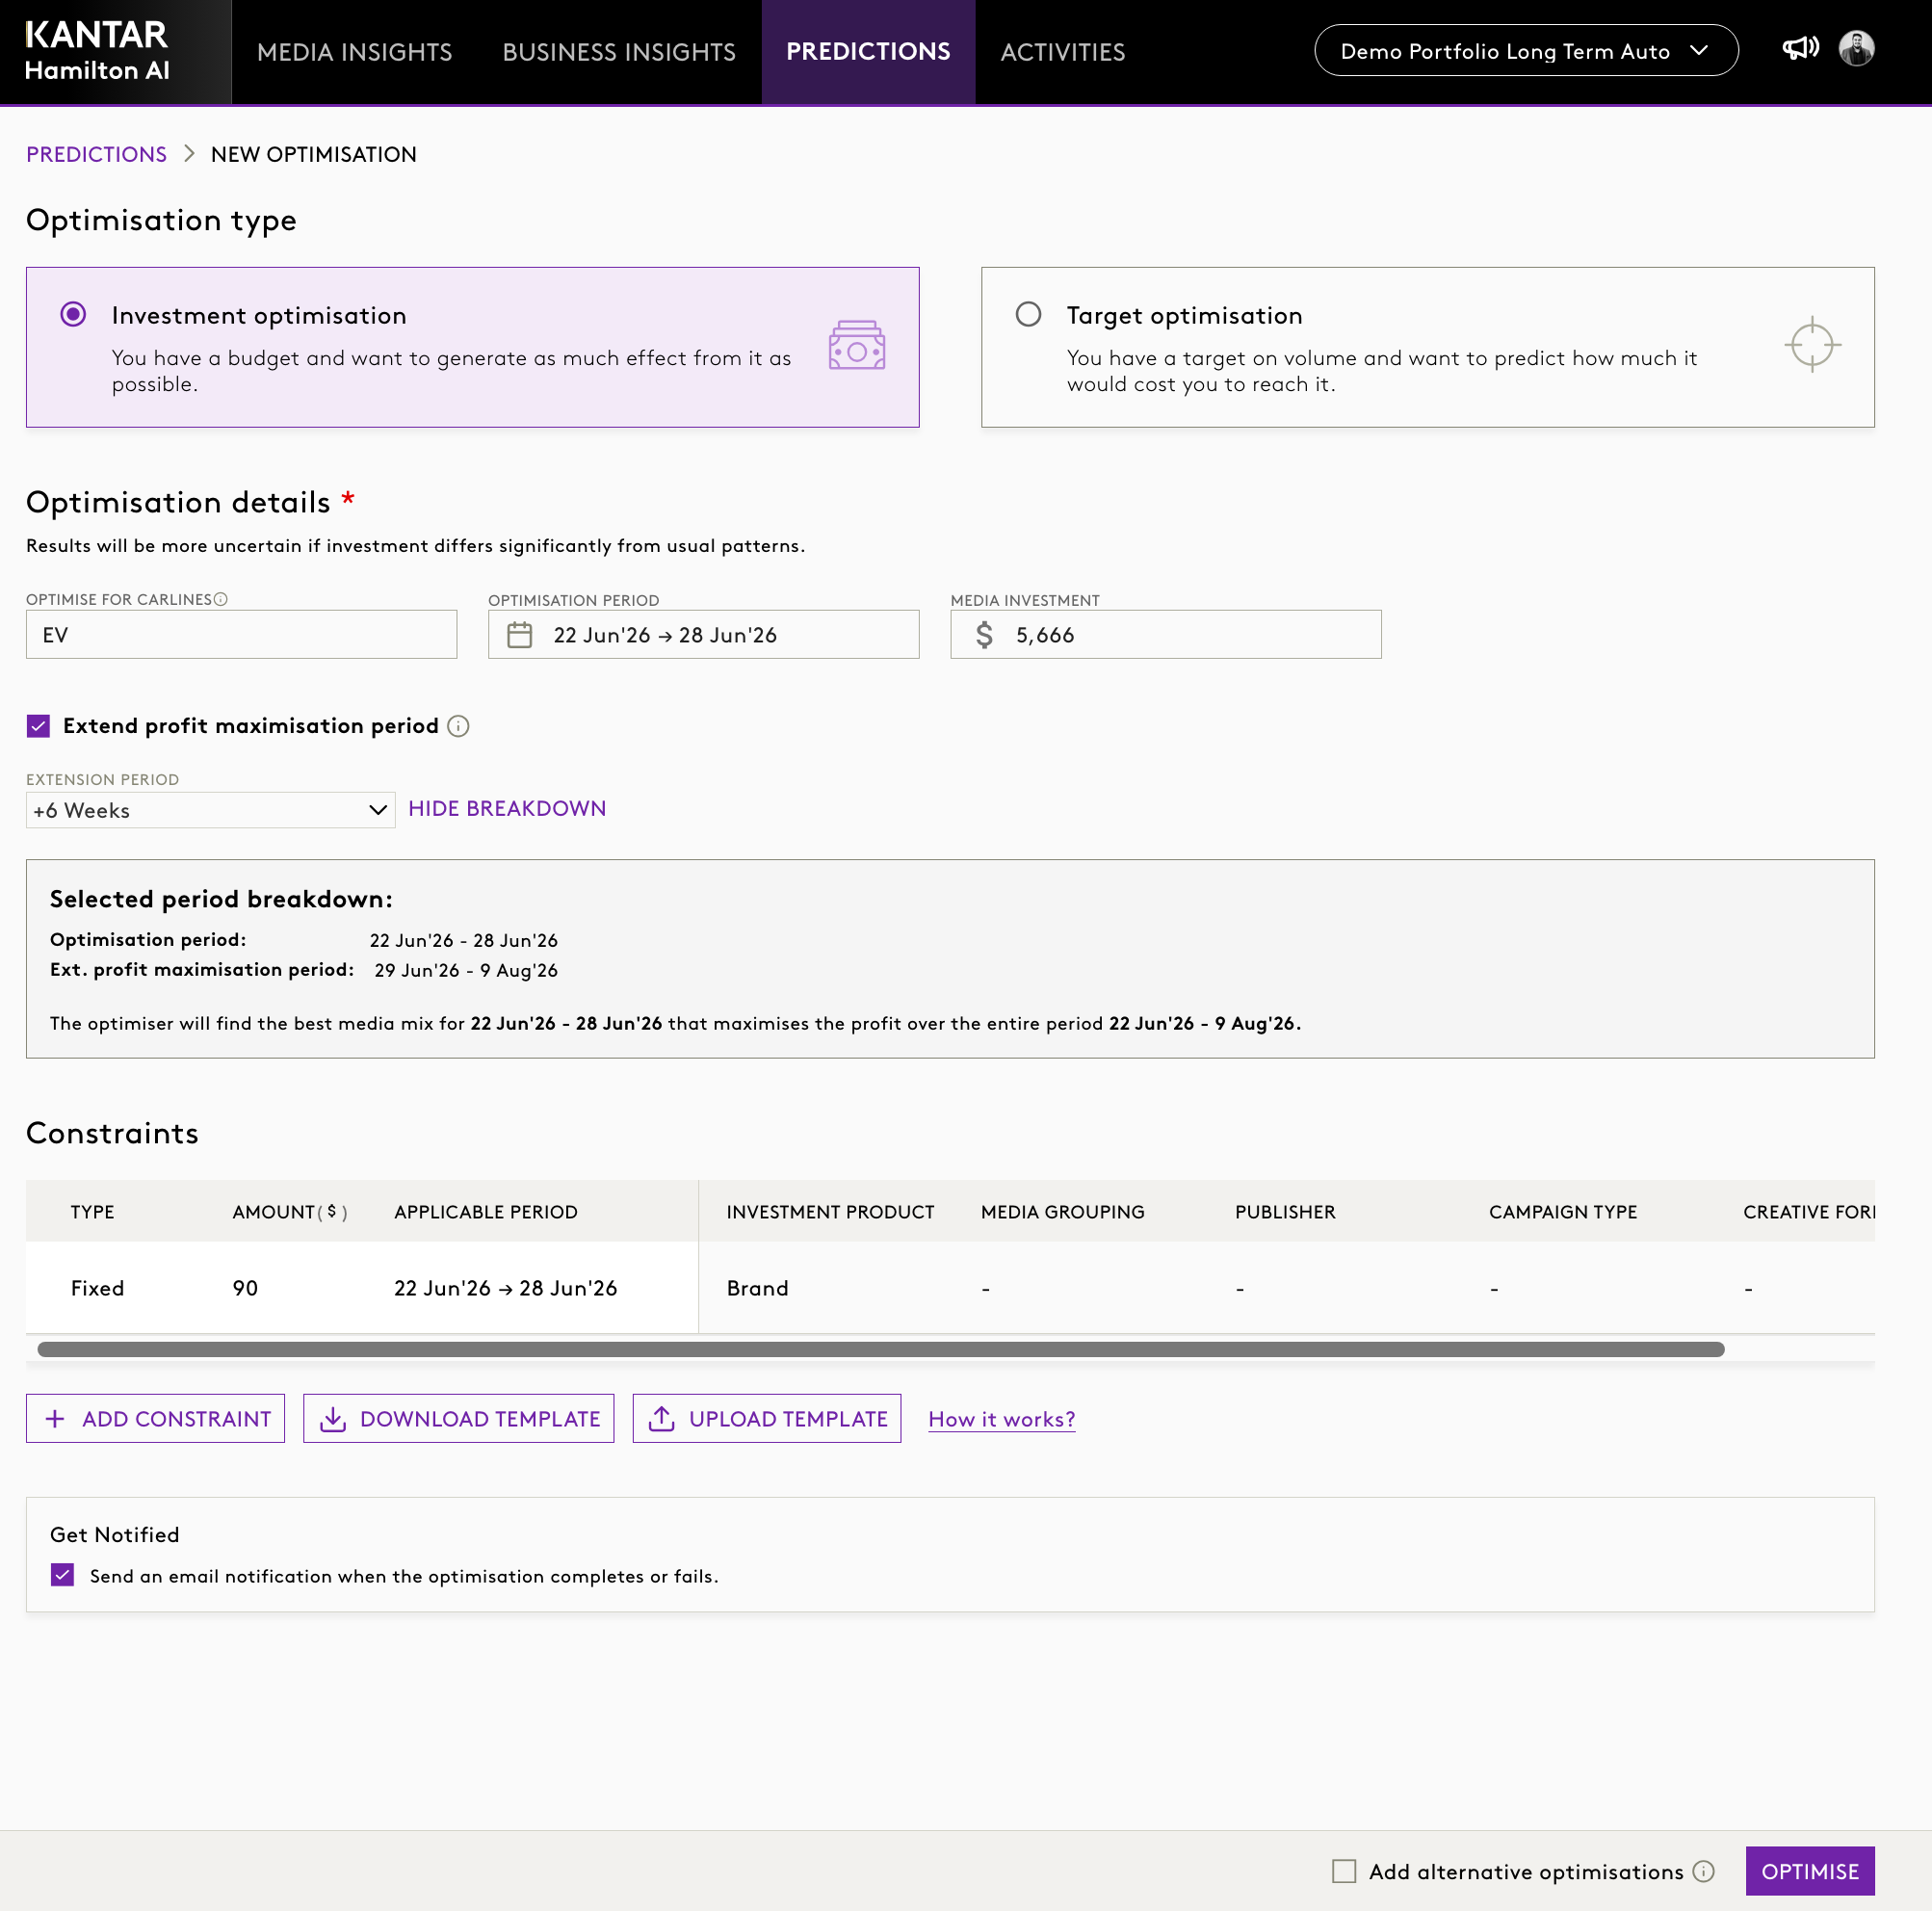
2. Dedicated Optimiser Configuration Page
The Optimiser input workflow has been redesigned from a pop-up modal to a dedicated full-page configuration experience.
Benefits
- Improved visibility of optimisation inputs and constraints
- Better support for complex optimisation scenarios
- More space for future configuration options and guidance
- Enhanced usability through a clearer page layout
What's changed?
- Optimiser inputs now open in a dedicated page.
- Existing functionality remains unchanged.
- Users can navigate away without losing unsaved changes and will receive a warning prompt when applicable.
Was this article helpful?
That’s Great!
Thank you for your feedback
Sorry! We couldn't be helpful
Thank you for your feedback
Feedback sent
We appreciate your effort and will try to fix the article